iPhoneдЄЛзЪДеی嚥ж°ЖжЮґеєґдЄНжШѓеЊИе§ЪгАВеЕґдЄ≠жѓФиЊГзЯ•еРНзЪДе∞±дЄ§дЄ™s7graphviewеТМCore PlotгАВеЈІзЪДжШѓдЄ§дЄ™йГљжШѓGoogleзЪДгАВеЙНиАЕдљњзФ®зЃАеНХпЉМдљЖеКЯиГљеНХдЄАпЉМеП™иГљзФїжЫ≤зЇњеЫЊгАВеРОиАЕжШѓеЉАжЇРй°єзЫЃпЉМй°єзЫЃдїНеЬ®дЄНжЦ≠жЫіжЦ∞дЄ≠пЉМзФ®иµЈжЭ•еПѓе∞±е§НжЭВе§ЪдЇЖпЉМиАМдЄФеРДдЄ™зЙИжЬђдЉЪжЬЙеЈЃеЉВпЉМеМЕжЛђе±ЮжАІгАБжЦєж≥ХпЉМзФЪиЗ≥жШѓз±їеРНйГљжЬЙжФєеПШгАВ
еЕ≥дЇОCore PlotдљњзФ®зЪДдЄ≠жЦЗзљСдЄКиµДжЦЩпЉМдЄНжШѓзЉЇдєПпЉМиАМжШѓж†єжЬђж≤°жЬЙгАВеФѓдЄАзЪДдЄАзѓЗдїЛзїНеЊЧжѓФиЊГиѓ¶зїЖзЪДжЦЗзЂ†жШѓвАЬUsing Core Plot in an iPhone ApplicationвАЭпЉМ еОЯжЦЗжШѓиЛ±жЦЗзЪДпЉЪhttp://www.switchonthecode.com/tutorials/using-core-plot-in-an-iphone-applicationгАВ
дљЖжЧґйЧізЬЯзЪДж؃姙иАБдЇЖпЉМе±ЕзДґжШѓ09еєі5жЬИеПСи°®зЪДпЉМеОЯжЦЗеЊИе§ЪеЬ∞жЦєеЈ≤зїПдЄНеЖНйАВзФ®гАВеЫ†ж≠§жИСиієдЇЖе•ље§ІзЪДеК≤пЉМжЙНжККеОЯжЦЗдЄ≠зЪДдї£з†БиЈСйАЪдЇЖпЉМдЄНжХҐзЛђдЇЂпЉМдЄОеРДдљНеЕ±дЇЂдєЛгАВ
дЄАгАБдЄЛиљљеЃЙи£ЕCore Plotж°ЖжЮґ
еОЯжЦЗдїЛзїНзЪДжШѓвАЬжЇРдї£з†БвАЭзЙИжЬђгАВй¶ЦеЕИдЄЛиљљеєґеЃЙи£ЕMercurialпЉИеЊИзЃАеНХпЉМеЬ®http://www.selenic.com/mercurial/wiki/жЬЙж†ЗеЗЖMacеЃЙи£ЕеМЕдЄЛиљљпЉЙпЉМеЖНдљњзФ®еСљдї§пЉЪ
hg clone http://core-plot.googlecode.com/hg/ core-plot
еН≥еПѓжККCore Plotй°єзЫЃжЇРдї£з†БдЄЛиљљеИ∞жМЗеЃЪзЫЃељХcore-plotдЄЛгАВ
жИ™иЗ≥жЬђжЦЗеПСи°®жЧґж≠ҐпЉМCore PlotеЈ≤зїПжПРдЊЫдЇЖMacж†ЗеЗЖеЃЙи£ЕеЩ®CorePlotInstaller_0.2.2.zip,дљ†еПѓдї•зЫіжО•зФ®еЃЙи£ЕеЩ®еЃЙи£ЕпЉМеПѓдї•еЊИжЦєдЊњеЬ∞жККCore PlotзЫіжО•дї•SDKзЪДжЦєеЉПеЃЙи£ЕеИ∞жЬђжЬЇгАВSDKзЪДдљњзФ®жЦєж≥ХиІБеРОдЄАзѓЗеНЪжЦЗгАКCore
Plot SDKзЪДзФ®ж≥ХгАЛгАВ
дЇМгАБе¶ВдљХеЬ®й°єзЫЃдЄ≠дљњзФ®Core Plot
зФ±дЇОiOSзЪДйЩРеИґпЉМCore Plotдї•йЭЩжАБеЇУзЪД嚥еЉПйУЊжО•еИ∞iPhoneеЇФзФ®гАВеЬ®core-plot/frameworkзЫЃељХдЄЛе≠ШеЬ®CorePlot-CocoaTouch.xcodeprojжЦЗдїґпЉМињЩе∞±жШѓдЄАдЄ™йЭЩжАБеЇУй°єзЫЃгАВеЕ≥дЇОйЭЩжАБеЇУзЪДдљњзФ®пЉМеЙНдЄАзѓЗеНЪжЦЗгАКе∞Би£ЕиЗ™еЈ±зЪДжОІдїґеЇУпЉЪiPhoneйЭЩжАБеЇУзЪДеЇФзФ®гАЛеЈ≤зїПжЬЙдїЛзїНпЉМдљњзФ®жЦєж≥ХйГљжШѓдЄАж†ЈзЪДгАВ
1гАБжЦ∞еїЇWindows-base Applicationй°єзЫЃгАВ
2гАБдљњзФ®Add->Existing FilesвА¶пЉМжККCorePlot-CocoaTouch.xcodeprojжЈїеК†еИ∞жЦ∞й°єзЫЃдЄ≠гАВ
3гАБжККlibCorePlot-CocoaTouch.aжЬАеП≥иЊєзЪДвАЬadd to targetвАЭе∞Пж°ЖеЛЊдЄКгАВ
4гАБйАЙжЛ©Target вАЬinfoпЉН>GeneralвАЭпЉМжЈїеК†еѓєй°єзЫЃCorePlot-CocoaTouchзЪДдЊЭиµЦпЉИеЉХзФ®пЉЙгАВ
5гАБйАЙжЛ©жЦ∞й°єзЫЃзЪДвАЬinfo->BuildвАЭпЉМеЬ®вАЬHeader Search PathsвАЭдЄ≠жЈїеК†Core Plotе§іжЦЗдїґжРЬ糥裃еЊДпЉМе¶ВпЉЪ/Users/kmyhy/core-plot/frameworkгАВж≥®жДПи¶БйАЙдЄ≠вАЬRecursiveвАЭе∞ПеЛЊпЉИиЛ±жЦЗеОЯжЦЗдЄ≠ж≤°жЬЙжПРињЩдЄАзВєпЉЙгАВеРМжЧґпЉМеЬ®Other Linker FlagsдЄ≠и¶БеҐЮеК†дЄ§дЄ™йАЙй°єпЉЪ-ObjCеТМ-all_loadпЉИиЛ±жЦЗеОЯжЦЗдЄ≠йБЧжЉПдЇЖзђђ2дЄ™йАЙй°єпЉЙгАВ
6гАБжЦ∞еїЇдЄАдЄ™ViewControllerпЉМе¶ВTestViewControllerгАВеЬ®жЬђдЊЛдЄ≠пЉМжИСдїђеЛЊйАЙдЇЖвАЬWith XibвАЭйАЙй°єгАВеЬ®иЛ±жЦЗеОЯжЦЗдЄ≠пЉМи¶Бж±ВеЬ®Interface BuildдЄ≠жККxibзЪДViewеѓєи±°зФ±UIViewжФєдЄЇCPLayerHostingViewпЉИеЕґеЃЮеЇФељУжШѓCPGraphHostingViewпЉЙгАВдљЖеЬ®ињЩйЗМпЉМеЕґеЃЮж≤°жЬЙењЕи¶БпЉМеП™йЬАеЬ®жЇРдї£з†БдЄ≠дњЃжФєе∞±еПѓдї•дЇЖгАВ
7гАБ.hжЦЗдїґпЉЪ
#import<UIKit/UIKit.h>
#import"CorePlot-CocoaTouch.h"
@interfaceTestViewController : UIViewController <CPPlotDataSource>{
CPXYGraph*graph;
}
@end
8гАБ.mжЦЗдїґпЉЪ
#import"TestViewController.h"
@implementationTestViewController
-(NSUInteger)numberOfRecordsForPlot:(CPPlot*)plot {
return51;
}
-(NSNumber*)numberForPlot:(CPPlot*)plot field:(NSUInteger)fieldEnum recordIndex:(NSUInteger)index {
doubleval = (index/5.0)-5;
if(fieldEnum ==CPScatterPlotFieldX)
{return[NSNumbernumberWithDouble:val]; }
else
{
if(plot.identifier==@"X Squared Plot")
{return[NSNumbernumberWithDouble:val*val]; }
else
{return[NSNumbernumberWithDouble:1/val]; }
}
}
- (void)viewDidLoad {
//[super viewDidLoad];
graph= [[CPXYGraphalloc]initWithFrame:self.view.bounds];
//еОЯжЭ•зЪДCPLayerHostingViewзФ±CPGraphHostingViewжЙАдї£жЫњ
self.view= [[CPGraphHostingViewalloc]initWithFrame:[UIScreenmainScreen].bounds];
CPGraphHostingView*hostingView = (CPGraphHostingView*)self.view;
hostingView.hostedGraph=graph;
graph.paddingLeft=20.0;
graph.paddingTop=20.0;
graph.paddingRight=20.0;
graph.paddingBottom=20.0;
CPXYPlotSpace*plotSpace = (CPXYPlotSpace*)graph.defaultPlotSpace;
plotSpace.xRange= [CPPlotRangeplotRangeWithLocation:CPDecimalFromFloat(-6)
length:CPDecimalFromFloat(12)];
plotSpace.yRange= [CPPlotRangeplotRangeWithLocation:CPDecimalFromFloat(-5)
length:CPDecimalFromFloat(30)];
CPLineStyle*lineStyle = [CPLineStylelineStyle];
//CPLineStyleзЪДlineColorеТМlineWidthеЈ≤зїПеПШдЄЇеП™иѓїе±ЮжАІ
//lineStyle.lineColor = [CPColor blackColor];
//lineStyle.lineWidth = 2.0f;
CPXYAxisSet*axisSet = (CPXYAxisSet*)graph.axisSet;
//majorIntervalLengthзЪДз±їеЮЛзФ±NSDecimalNumberжФєеПШдЄЇNSDecimal
axisSet.xAxis.majorIntervalLength= [[NSDecimalNumberdecimalNumberWithString:@"5"]decimalValue];
axisSet.xAxis.minorTicksPerInterval=4;
axisSet.xAxis.majorTickLineStyle= lineStyle;
axisSet.xAxis.minorTickLineStyle= lineStyle;
axisSet.xAxis.axisLineStyle= lineStyle;
axisSet.xAxis.minorTickLength=5.0f;
axisSet.xAxis.majorTickLength=7.0f;
//axisLableOffsetе±ЮжАІзФ±labelOffsetжЙАдї£жЫњ
axisSet.xAxis.labelOffset=3.0f;
//axisSet.xAxis.axisLabelOffset = 3.0f;
axisSet.yAxis.majorIntervalLength= [[NSDecimalNumberdecimalNumberWithString:@"5"]decimalValue];
axisSet.yAxis.minorTicksPerInterval=4;
axisSet.yAxis.majorTickLineStyle= lineStyle;
axisSet.yAxis.minorTickLineStyle= lineStyle;
axisSet.yAxis.axisLineStyle= lineStyle;
axisSet.yAxis.minorTickLength=5.0f;
axisSet.yAxis.majorTickLength=7.0f;
//axisLableOffsetе±ЮжАІзФ±labelOffsetжЙАдї£жЫњ
axisSet.yAxis.labelOffset=3.0f;
//axisSet.yAxis.axisLabelOffset = 3.0f;
//CPPlotSpaceзЪДboundsе±ЮжАІдЄНеЖНжЬЙжХИ
CPScatterPlot*xSquaredPlot = [[[CPScatterPlotalloc]
initWithFrame:self.view.bounds]autorelease];
//initWithFrame:graph.defaultPlotSpace.bounds] autorelease];
xSquaredPlot.identifier=@"X Squared Plot";
//CPLineStyleзЪДlineColorеТМlineWidthеЈ≤зїПеПШдЄЇеП™иѓїе±ЮжАІ
//xSquaredPlot.dataLineStyle.lineWidth = 1.0f;
//xSquaredPlot.dataLineStyle.lineColor = [CPColor redColor];
xSquaredPlot.dataSource=self;
[graphaddPlot:xSquaredPlot];
CPPlotSymbol*greenCirclePlotSymbol = [CPPlotSymbolellipsePlotSymbol];
greenCirclePlotSymbol.fill= [CPFillfillWithColor:[CPColorgreenColor]];
greenCirclePlotSymbol.size=CGSizeMake(2.0,2.0);
xSquaredPlot.plotSymbol= greenCirclePlotSymbol;
//CPPlotSpaceзЪДboundsе±ЮжАІдЄНеЖНжЬЙжХИ
CPScatterPlot*xInversePlot = [[[CPScatterPlotalloc]
initWithFrame:self.view.bounds]autorelease];
//initWithFrame:graph.defaultPlotSpace.bounds] autorelease];
xInversePlot.identifier=@"X Inverse Plot";
//CPLineStyleзЪДlineColorеТМlineWidthеЈ≤зїПеПШдЄЇеП™иѓїе±ЮжАІ
//xInversePlot.dataLineStyle.lineWidth = 1.0f;
//xInversePlot.dataLineStyle.lineColor = [CPColor blueColor];
xInversePlot.dataSource=self;
[graphaddPlot:xInversePlot];
}
- (void)dealloc {
[superdealloc];
}
@end
дїФзїЖжЯ•зЬЛдї£з†БпЉМдљ†дЉЪеПСзО∞еОЯжЦЗдЄ≠зЪДдї£з†Б襀жИСеБЪдЇЖдЄАдЇЫдњЃжФєеТМи∞ГжХігАВ
йЩДдЄАеЉ†Core Plotж°ЖжЮґзЪДз±їе±Вжђ°еЫЊпЉМдЊњдЇОзРЖиІ£дї£з†БдЄ≠еРДдЄ™еѓєи±°зЪДдљњзФ®пЉЪ
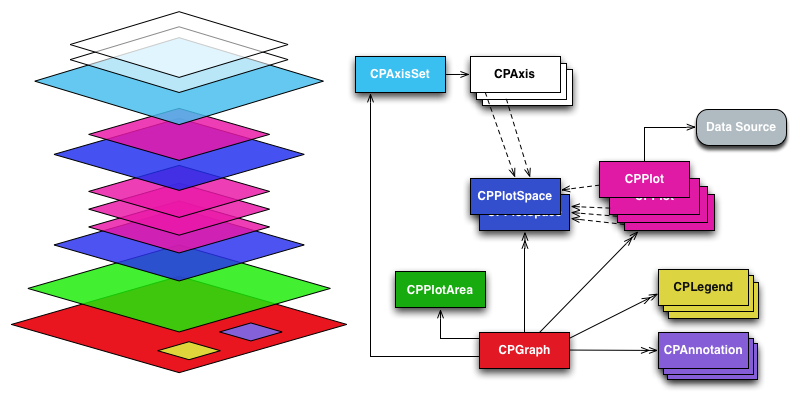
ж≥®жДПпЉМеП≥иЊєеРДдЄ™з±їзЪДйҐЬиЙ≤еТМеЈ¶иЊєеРДдЄ™е±Вжђ°зЪДйҐЬиЙ≤жШѓеѓєеЇФзЪДгАВ
еОЯжЦЗеЬ∞еЭАпЉЪhttp://blog.csdn.net/kmyhy/article/details/6213083
iPhoneдЄЛзЪДеی嚥ж°ЖжЮґеєґдЄНжШѓеЊИе§ЪгАВеЕґдЄ≠жѓФиЊГзЯ•еРНзЪДе∞±дЄ§дЄ™s7graphviewеТМCore PlotгАВеЈІзЪДжШѓдЄ§дЄ™йГљжШѓGoogleзЪДгАВеЙНиАЕдљњзФ®зЃАеНХпЉМдљЖеКЯиГљеНХдЄАпЉМеП™иГљзФїжЫ≤зЇњеЫЊгАВеРОиАЕжШѓеЉАжЇРй°єзЫЃпЉМй°єзЫЃдїНеЬ®дЄНжЦ≠жЫіжЦ∞дЄ≠пЉМзФ®иµЈжЭ•еПѓе∞±е§НжЭВе§ЪдЇЖпЉМиАМдЄФеРДдЄ™зЙИжЬђдЉЪжЬЙеЈЃеЉВпЉМеМЕжЛђе±ЮжАІгАБжЦєж≥ХпЉМзФЪиЗ≥жШѓз±їеРНйГљжЬЙжФєеПШгАВ
еЕ≥дЇОCore PlotдљњзФ®зЪДдЄ≠жЦЗзљСдЄКиµДжЦЩпЉМдЄНжШѓзЉЇдєПпЉМиАМжШѓж†єжЬђж≤°жЬЙгАВеФѓдЄАзЪДдЄАзѓЗдїЛзїНеЊЧжѓФиЊГиѓ¶зїЖзЪДжЦЗзЂ†жШѓвАЬUsing Core Plot in an iPhone ApplicationвАЭпЉМ еОЯжЦЗжШѓиЛ±жЦЗзЪДпЉЪhttp://www.switchonthecode.com/tutorials/using-core-plot-in-an-iphone-applicationгАВ
дљЖжЧґйЧізЬЯзЪДж؃姙иАБдЇЖпЉМе±ЕзДґжШѓ09еєі5жЬИеПСи°®зЪДпЉМеОЯжЦЗеЊИе§ЪеЬ∞жЦєеЈ≤зїПдЄНеЖНйАВзФ®гАВеЫ†ж≠§жИСиієдЇЖе•ље§ІзЪДеК≤пЉМжЙНжККеОЯжЦЗдЄ≠зЪДдї£з†БиЈСйАЪдЇЖпЉМдЄНжХҐзЛђдЇЂпЉМдЄОеРДдљНеЕ±дЇЂдєЛгАВ
дЄАгАБдЄЛиљљеЃЙи£ЕCore Plotж°ЖжЮґ
еОЯжЦЗдїЛзїНзЪДжШѓвАЬжЇРдї£з†БвАЭзЙИжЬђгАВй¶ЦеЕИдЄЛиљљеєґеЃЙи£ЕMercurialпЉИеЊИзЃАеНХпЉМеЬ®http://www.selenic.com/mercurial/wiki/жЬЙж†ЗеЗЖMacеЃЙи£ЕеМЕдЄЛиљљпЉЙпЉМеЖНдљњзФ®еСљдї§пЉЪ
hg clone http://core-plot.googlecode.com/hg/ core-plot
еН≥еПѓжККCore Plotй°єзЫЃжЇРдї£з†БдЄЛиљљеИ∞жМЗеЃЪзЫЃељХcore-plotдЄЛгАВ
жИ™иЗ≥жЬђжЦЗеПСи°®жЧґж≠ҐпЉМCore PlotеЈ≤зїПжПРдЊЫдЇЖMacж†ЗеЗЖеЃЙи£ЕеЩ®CorePlotInstaller_0.2.2.zip,дљ†еПѓдї•зЫіжО•зФ®еЃЙи£ЕеЩ®еЃЙи£ЕпЉМеПѓдї•еЊИжЦєдЊњеЬ∞жККCore PlotзЫіжО•дї•SDKзЪДжЦєеЉПеЃЙи£ЕеИ∞жЬђжЬЇгАВSDKзЪДдљњзФ®жЦєж≥ХиІБеРОдЄАзѓЗеНЪжЦЗгАКCore
Plot SDKзЪДзФ®ж≥ХгАЛгАВ
дЇМгАБе¶ВдљХеЬ®й°єзЫЃдЄ≠дљњзФ®Core Plot
зФ±дЇОiOSзЪДйЩРеИґпЉМCore Plotдї•йЭЩжАБеЇУзЪД嚥еЉПйУЊжО•еИ∞iPhoneеЇФзФ®гАВеЬ®core-plot/frameworkзЫЃељХдЄЛе≠ШеЬ®CorePlot-CocoaTouch.xcodeprojжЦЗдїґпЉМињЩе∞±жШѓдЄАдЄ™йЭЩжАБеЇУй°єзЫЃгАВеЕ≥дЇОйЭЩжАБеЇУзЪДдљњзФ®пЉМеЙНдЄАзѓЗеНЪжЦЗгАКе∞Би£ЕиЗ™еЈ±зЪДжОІдїґеЇУпЉЪiPhoneйЭЩжАБеЇУзЪДеЇФзФ®гАЛеЈ≤зїПжЬЙдїЛзїНпЉМдљњзФ®жЦєж≥ХйГљжШѓдЄАж†ЈзЪДгАВ
1гАБжЦ∞еїЇWindows-base Applicationй°єзЫЃгАВ
2гАБдљњзФ®Add->Existing FilesвА¶пЉМжККCorePlot-CocoaTouch.xcodeprojжЈїеК†еИ∞жЦ∞й°єзЫЃдЄ≠гАВ
3гАБжККlibCorePlot-CocoaTouch.aжЬАеП≥иЊєзЪДвАЬadd to targetвАЭе∞Пж°ЖеЛЊдЄКгАВ
4гАБйАЙжЛ©Target вАЬinfoпЉН>GeneralвАЭпЉМжЈїеК†еѓєй°єзЫЃCorePlot-CocoaTouchзЪДдЊЭиµЦпЉИеЉХзФ®пЉЙгАВ
5гАБйАЙжЛ©жЦ∞й°єзЫЃзЪДвАЬinfo->BuildвАЭпЉМеЬ®вАЬHeader Search PathsвАЭдЄ≠жЈїеК†Core Plotе§іжЦЗдїґжРЬ糥裃еЊДпЉМе¶ВпЉЪ/Users/kmyhy/core-plot/frameworkгАВж≥®жДПи¶БйАЙдЄ≠вАЬRecursiveвАЭе∞ПеЛЊпЉИиЛ±жЦЗеОЯжЦЗдЄ≠ж≤°жЬЙжПРињЩдЄАзВєпЉЙгАВеРМжЧґпЉМеЬ®Other Linker FlagsдЄ≠и¶БеҐЮеК†дЄ§дЄ™йАЙй°єпЉЪ-ObjCеТМ-all_loadпЉИиЛ±жЦЗеОЯжЦЗдЄ≠йБЧжЉПдЇЖзђђ2дЄ™йАЙй°єпЉЙгАВ
6гАБжЦ∞еїЇдЄАдЄ™ViewControllerпЉМе¶ВTestViewControllerгАВеЬ®жЬђдЊЛдЄ≠пЉМжИСдїђеЛЊйАЙдЇЖвАЬWith XibвАЭйАЙй°єгАВеЬ®иЛ±жЦЗеОЯжЦЗдЄ≠пЉМи¶Бж±ВеЬ®Interface BuildдЄ≠жККxibзЪДViewеѓєи±°зФ±UIViewжФєдЄЇCPLayerHostingViewпЉИеЕґеЃЮеЇФељУжШѓCPGraphHostingViewпЉЙгАВдљЖеЬ®ињЩйЗМпЉМеЕґеЃЮж≤°жЬЙењЕи¶БпЉМеП™йЬАеЬ®жЇРдї£з†БдЄ≠дњЃжФєе∞±еПѓдї•дЇЖгАВ
7гАБ.hжЦЗдїґпЉЪ
#import<UIKit/UIKit.h>
#import"CorePlot-CocoaTouch.h"
@interfaceTestViewController : UIViewController <CPPlotDataSource>{
CPXYGraph*graph;
}
@end
8гАБ.mжЦЗдїґпЉЪ
#import"TestViewController.h"
@implementationTestViewController
-(NSUInteger)numberOfRecordsForPlot:(CPPlot*)plot {
return51;
}
-(NSNumber*)numberForPlot:(CPPlot*)plot field:(NSUInteger)fieldEnum recordIndex:(NSUInteger)index {
doubleval = (index/5.0)-5;
if(fieldEnum ==CPScatterPlotFieldX)
{return[NSNumbernumberWithDouble:val]; }
else
{
if(plot.identifier==@"X Squared Plot")
{return[NSNumbernumberWithDouble:val*val]; }
else
{return[NSNumbernumberWithDouble:1/val]; }
}
}
- (void)viewDidLoad {
//[super viewDidLoad];
graph= [[CPXYGraphalloc]initWithFrame:self.view.bounds];
//еОЯжЭ•зЪДCPLayerHostingViewзФ±CPGraphHostingViewжЙАдї£жЫњ
self.view= [[CPGraphHostingViewalloc]initWithFrame:[UIScreenmainScreen].bounds];
CPGraphHostingView*hostingView = (CPGraphHostingView*)self.view;
hostingView.hostedGraph=graph;
graph.paddingLeft=20.0;
graph.paddingTop=20.0;
graph.paddingRight=20.0;
graph.paddingBottom=20.0;
CPXYPlotSpace*plotSpace = (CPXYPlotSpace*)graph.defaultPlotSpace;
plotSpace.xRange= [CPPlotRangeplotRangeWithLocation:CPDecimalFromFloat(-6)
length:CPDecimalFromFloat(12)];
plotSpace.yRange= [CPPlotRangeplotRangeWithLocation:CPDecimalFromFloat(-5)
length:CPDecimalFromFloat(30)];
CPLineStyle*lineStyle = [CPLineStylelineStyle];
//CPLineStyleзЪДlineColorеТМlineWidthеЈ≤зїПеПШдЄЇеП™иѓїе±ЮжАІ
//lineStyle.lineColor = [CPColor blackColor];
//lineStyle.lineWidth = 2.0f;
CPXYAxisSet*axisSet = (CPXYAxisSet*)graph.axisSet;
//majorIntervalLengthзЪДз±їеЮЛзФ±NSDecimalNumberжФєеПШдЄЇNSDecimal
axisSet.xAxis.majorIntervalLength= [[NSDecimalNumberdecimalNumberWithString:@"5"]decimalValue];
axisSet.xAxis.minorTicksPerInterval=4;
axisSet.xAxis.majorTickLineStyle= lineStyle;
axisSet.xAxis.minorTickLineStyle= lineStyle;
axisSet.xAxis.axisLineStyle= lineStyle;
axisSet.xAxis.minorTickLength=5.0f;
axisSet.xAxis.majorTickLength=7.0f;
//axisLableOffsetе±ЮжАІзФ±labelOffsetжЙАдї£жЫњ
axisSet.xAxis.labelOffset=3.0f;
//axisSet.xAxis.axisLabelOffset = 3.0f;
axisSet.yAxis.majorIntervalLength= [[NSDecimalNumberdecimalNumberWithString:@"5"]decimalValue];
axisSet.yAxis.minorTicksPerInterval=4;
axisSet.yAxis.majorTickLineStyle= lineStyle;
axisSet.yAxis.minorTickLineStyle= lineStyle;
axisSet.yAxis.axisLineStyle= lineStyle;
axisSet.yAxis.minorTickLength=5.0f;
axisSet.yAxis.majorTickLength=7.0f;
//axisLableOffsetе±ЮжАІзФ±labelOffsetжЙАдї£жЫњ
axisSet.yAxis.labelOffset=3.0f;
//axisSet.yAxis.axisLabelOffset = 3.0f;
//CPPlotSpaceзЪДboundsе±ЮжАІдЄНеЖНжЬЙжХИ
CPScatterPlot*xSquaredPlot = [[[CPScatterPlotalloc]
initWithFrame:self.view.bounds]autorelease];
//initWithFrame:graph.defaultPlotSpace.bounds] autorelease];
xSquaredPlot.identifier=@"X Squared Plot";
//CPLineStyleзЪДlineColorеТМlineWidthеЈ≤зїПеПШдЄЇеП™иѓїе±ЮжАІ
//xSquaredPlot.dataLineStyle.lineWidth = 1.0f;
//xSquaredPlot.dataLineStyle.lineColor = [CPColor redColor];
xSquaredPlot.dataSource=self;
[graphaddPlot:xSquaredPlot];
CPPlotSymbol*greenCirclePlotSymbol = [CPPlotSymbolellipsePlotSymbol];
greenCirclePlotSymbol.fill= [CPFillfillWithColor:[CPColorgreenColor]];
greenCirclePlotSymbol.size=CGSizeMake(2.0,2.0);
xSquaredPlot.plotSymbol= greenCirclePlotSymbol;
//CPPlotSpaceзЪДboundsе±ЮжАІдЄНеЖНжЬЙжХИ
CPScatterPlot*xInversePlot = [[[CPScatterPlotalloc]
initWithFrame:self.view.bounds]autorelease];
//initWithFrame:graph.defaultPlotSpace.bounds] autorelease];
xInversePlot.identifier=@"X Inverse Plot";
//CPLineStyleзЪДlineColorеТМlineWidthеЈ≤зїПеПШдЄЇеП™иѓїе±ЮжАІ
//xInversePlot.dataLineStyle.lineWidth = 1.0f;
//xInversePlot.dataLineStyle.lineColor = [CPColor blueColor];
xInversePlot.dataSource=self;
[graphaddPlot:xInversePlot];
}
- (void)dealloc {
[superdealloc];
}
@end
дїФзїЖжЯ•зЬЛдї£з†БпЉМдљ†дЉЪеПСзО∞еОЯжЦЗдЄ≠зЪДдї£з†Б襀жИСеБЪдЇЖдЄАдЇЫдњЃжФєеТМи∞ГжХігАВ
йЩДдЄАеЉ†Core Plotж°ЖжЮґзЪДз±їе±Вжђ°еЫЊпЉМдЊњдЇОзРЖиІ£дї£з†БдЄ≠еРДдЄ™еѓєи±°зЪДдљњзФ®пЉЪ
ж≥®жДПпЉМеП≥иЊєеРДдЄ™з±їзЪДйҐЬиЙ≤еТМеЈ¶иЊєеРДдЄ™е±Вжђ°зЪДйҐЬиЙ≤жШѓеѓєеЇФзЪДгАВ
еОЯжЦЗеЬ∞еЭАпЉЪhttp://blog.csdn.net/kmyhy/article/details/6213083
еИЖдЇЂеИ∞пЉЪ


зЫЄеЕ≥жО®иНР
CorePlot 1.0 й•ЉеЫЊ demo
еЉХзФ®жЬАжЦ∞CorePlot 1.5еЇУпЉМж≥®йЗКеЊИиѓ¶зїЖпЉМеРДзІНиЗ™еЃЪдєЙ // Setup plot space: иЃЊзљЃдЄАе±ПеЖЕеПѓжШЊз§ЇзЪДx,yйЗПеЇ¶иМГеЫі CPTXYPlotSpace *plotSpace = (CPTXYPlotSpace *)[xyGraph defaultPlotSpace]; plotSpace.delegate = self...
дљњзФ®зђђдЄЙжЦєж°ЖжЮґcore Plot зїШеИґеЄЄзФ®зЪДжЯ±зКґеЫЊпЉМиЃ≤иІ£иЊГдЄЇиѓ¶зїЖпЉМйАВеРИеИЭе≠¶иАЕгАВ
жЙУеМЕcoreplotжЇРдї£з†БпЉМеПѓеЬ®ж®°жЛЯеЩ®еТМзЬЯжЬЇдЄКдљњзФ®
coreplot example CSDN姙壁
iOS(iPhone/iPad) дЄЛеی嚥зїДдїґжЬЙдЄ§дЄ™жЬЙеРНзЪДпЉМs7graphview еТМ Core PlotпЉМеЃГдїђйГљжШѓеЬ® Google дЄКжЙШзЃ°зЪДдї£з†БпЉМеРђиѓі Core Plot жѓФиЊГеЉЇпЉМеЫ†дЄЇеЙНиАЕдїЕжФѓжМБжЫ≤зЇњеЫЊпЉМеРОиАЕеСҐжЫ≤зЇњеЫЊгАБй•ЉеЫЊгАБжЯ±зКґеЫЊз≠ЙйАЪеРГпЉМдЄФиЊГжіїиЈГпЉМиѓ•иµДжЇРеМЕжЛђ...
еП™жШѓзФ®жЭ•е≠ШдЄАдЄЛиµДжЇРпЉМйЬАи¶БжЬАжЦ∞зЪДиЗ™еЈ±еОїеЃШзљСдЄЛиљљ
иЗ™еЈ±еЬ®зљСдЄКжСШзЪДжЫ≤зЇњеЫЊзЪДдї£з†БпЉМеПКзФ®ж≥ХпЉМжЦєдЊњеЉАеПСзЭАдљњзФ®
coreplotжЇРз†БпЉМзФ®дЇОзїШеИґжЫ≤зЇњеЫЊгАБжЯ±зКґеЫЊгАБиµ∞еКњеЫЊгАВгАВгАВ
еЉЇе§ІзЪДзїШеИґеЫЊи°®еЈ•еЕЈпЉМеМЕжЛђжКШзЇњеЫЊпЉМжЯ±зКґеЫЊпЉМй•ЉзКґеЫЊпЉМе∞±жШѓдљњзФ®иµЈжЭ•з®Нз®НжЬЙдЇЫйЇїзГ¶
CorePlot жФѓжМБarm64
Core-PlotдЉЉдєОжШѓжЬАе•љзЪДеЉАжЇРпЉМеЯЇдЇОCocoaзЪДеЫЊи°®еЇУгАВ дљЖжШѓпЉМжѓПељУжИСе∞ЭиѓХдљњзФ®еЃГжЧґпЉМжИСйГљдЉЪйЩЈеЕ•еЫ∞еҐГпЉМиѓХеЫЊеЉДжЄЕж•Ъе¶ВдљХдљњеЯЇжЬђеЫЊи°®ж≠£еЄЄеЈ•дљЬгАВ ињЩдЄ™й°єзЫЃжШѓжИСе∞ЭиѓХдљњзФ®иѓ•ж°ЖжЮґпЉМеѓєеЕґжЬЙжЙАдЇЖиІ£еєґиЃ∞ељХиѓ•дњ°жБѓдї•дЊЫдї•еРОдљњзФ®зЪДе∞ЭиѓХгАВ ...
еЖЕзљЃеєґеЬ®XcodeжЬђеЬ∞еЃЙи£ЕпЉИеПВиІБеЬ®READMEжЦЗдїґе§єжЯ•зЬЛиѓ¶жГЕпЉЙ GitHubдЄКзЪДдї£з†Бе≠ШеВ®еЇУдЄ≠зЪДжЦЗдїґе§єеЬ®еУ™йЗМеѓїж±ВеЄЃеК©йЧЃз≠ФзљСзЂЩGoogle Group Stackoverflow.comз§ЊдЇ§зљСзїЬиі°зМЃж†ЄењГеЫЊCore PlotжШѓдЄАдЄ™жЙШзЃ°еЬ®еЉАжЇРй°єзЫЃгАВ дЄїй°єзЫЃдЄЛжЬЙдЄ§дЄ™...
core plot жФЊеЬ®и∞Јж≠МдЄК гАВжЙУдЄНеЉА
Core PlotжШѓзФ®жЭ•еЬ®iOSдЄЛеЉАеПСиµ∞еКњеЫЊгАБжЯ±зКґеЫЊгАБй•ЉеЫЊз≠ЙзЪДеЈ•еЕЈз±їгАВ
жДЯи∞ҐжЬђзЊ§е∞ПдЄГеЕ±дЇЂзЪДеЈ•з®ЛгАВ 1.дљњзФ®core plotеЃЮзО∞з±їдЉЉиВ°з•®зЪДжЫ≤зЇњжХИжЮЬ 2.жФѓжМБжЙЛеКњдЇ§дЇТпЉМж†ЗжЭЖеПѓжїСеК®
plot жХЩз®Лplot жХЩз®Лplot жХЩз®Лplot жХЩз®Лplot жХЩз®Лplot жХЩз®Лplot жХЩз®Лplot жХЩз®Лplot жХЩз®Л
еЙНзЂѓеЉАжЇРеЇУ-contour_plotз≠ЙеАЉзЇњеЫЊпЉМжХ∞е≠¶еЗљжХ∞зЪДз≠ЙеАЉзЇњеЫЊ
еЃЮдЊЛеЈ•з®ЛжШѓдљњзФ®xcode6.0еИЫеїЇзЪДпЉМеѓєcoreplotзЪДдЄАдЄ™е∞Би£ЕпЉМдїЕдЊЫеПВиАГгАВ
matlab plotеЗљжХ∞ дЄ≠жЦЗдљњзФ®жЦєж≥Х